目次
Gold Market Overview (Swing Trade Strategy)
Let’s assess today’s gold market conditions.
Key points of the market environment:
- The Dollar Index has risen for two consecutive weeks; the strong dollar trend continues
- A downward trendline is forming
- Volatility has sharply declined over the past few weeks
Looking at the weekly chart, gold had been on a consistent uptrend since around October 2023, peaking near $3,500 before the momentum began to fade.
The rally was intense, and there was little major correction on the weekly scale.
However, recently gold’s volatility has decreased significantly, and a triangle pattern is forming with lower highs and higher lows.
On the daily chart, the Alligator indicator shows that the “mouth is closed” — a sleeping alligator.
Just like a hungry alligator eventually opens its mouth wide, the market may also be poised for a big move soon.
If a breakout occurs to the upside, $3,500 could be the target.
If it breaks to the downside, around $3,250 may become the focus.
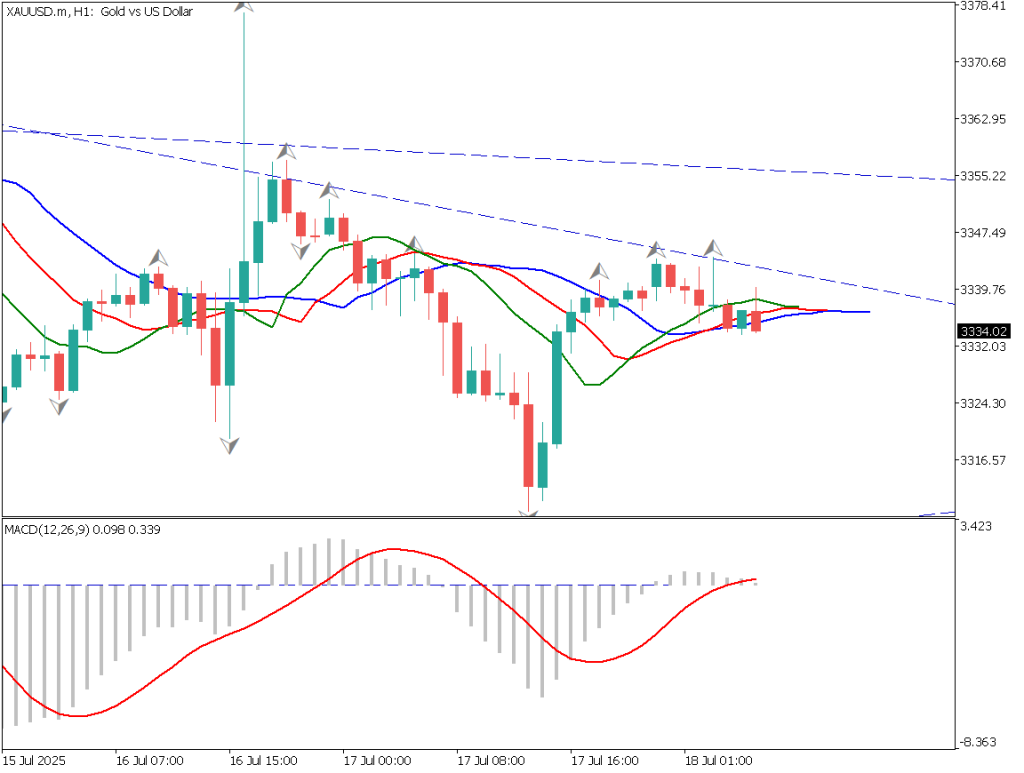
XAUUSD Day Trading Strategy
Gold is in a downward bias, capped by a trendline.
Fractals appear near this trendline, suggesting that past resistance has led to pullbacks.
Although the downtrend is modest, strong dip buying prevents a decisive trend from forming.
As a day trade strategy, consider placing a buy limit order around the $3,300 level.
If the trendline is clearly broken to the upside, it may signal a new trend — and we should follow it.
With few clear fundamental drivers, gold is likely to continue searching for direction.
Let’s watch for a technical breakout and remain patient for now.
Key Economic Events Today
| Event/Indicator | Time(JPT) |
| US – Housing Starts | 21:30 |
| US – University of Michigan Consumer Sentiment Index | 23:00 |